GLMap

Profiling genomic language models as individuals in a population

Yusen Hou1, Weicai Long1, Houcheng Su1, Junning Feng1, Yanlin Zhang1,2,*
1Data Science and Analytics Thrust, The Hong Kong University of Science and Technology (Guangzhou)
2The Hong Kong University of Science and Technology, Hong Kong
*Corresponding author: yanlinzhang@hkust-gz.edu.cn
In submission, 2026

One-line summary

We profile each genomic language model by its responses to a fixed DNA probe panel and compare them as individuals in a population.

Illustrated overview

Whimsical illustrated overview of GLMap

Graphical abstract. A playful summary of GLMap: scoring every model with a fixed 10,000-probe DNA panel, fingerprinting each model's likelihood response, unifying AR and MLM models in one space, and the resulting model map that clusters by family and domain and predicts downstream performance. Illustration generated with NotebookLM.
*This illustration is just for illustration purpose and does not reflect the actual results of GLMap*.

Key results

One common space for AR & MLM. Scoring paradigm (training paradigm) explains just 1.9% of the variance in Vd; family explains 53.8%.

Probe-robust distances. Splitting the panel into two halves with entirely different functional elements, the model-pair distances computed independently on each half correlate at Mantel r = 0.835.

Recovers known structure. Models cluster by family and by training domain, consistent with documented relationships.

Predicts task performance. The mean AUC over six downstream tasks predicted from GLMap signatures and the benchmark scores correlate at Spearman ρ = 0.705.

GLMs are Individuals in a Population

Genomic language models (GLMs) are multiplying fast and differ widely in architecture, training paradigm, and data. Comparing them in a principled way matters for building better models and for 
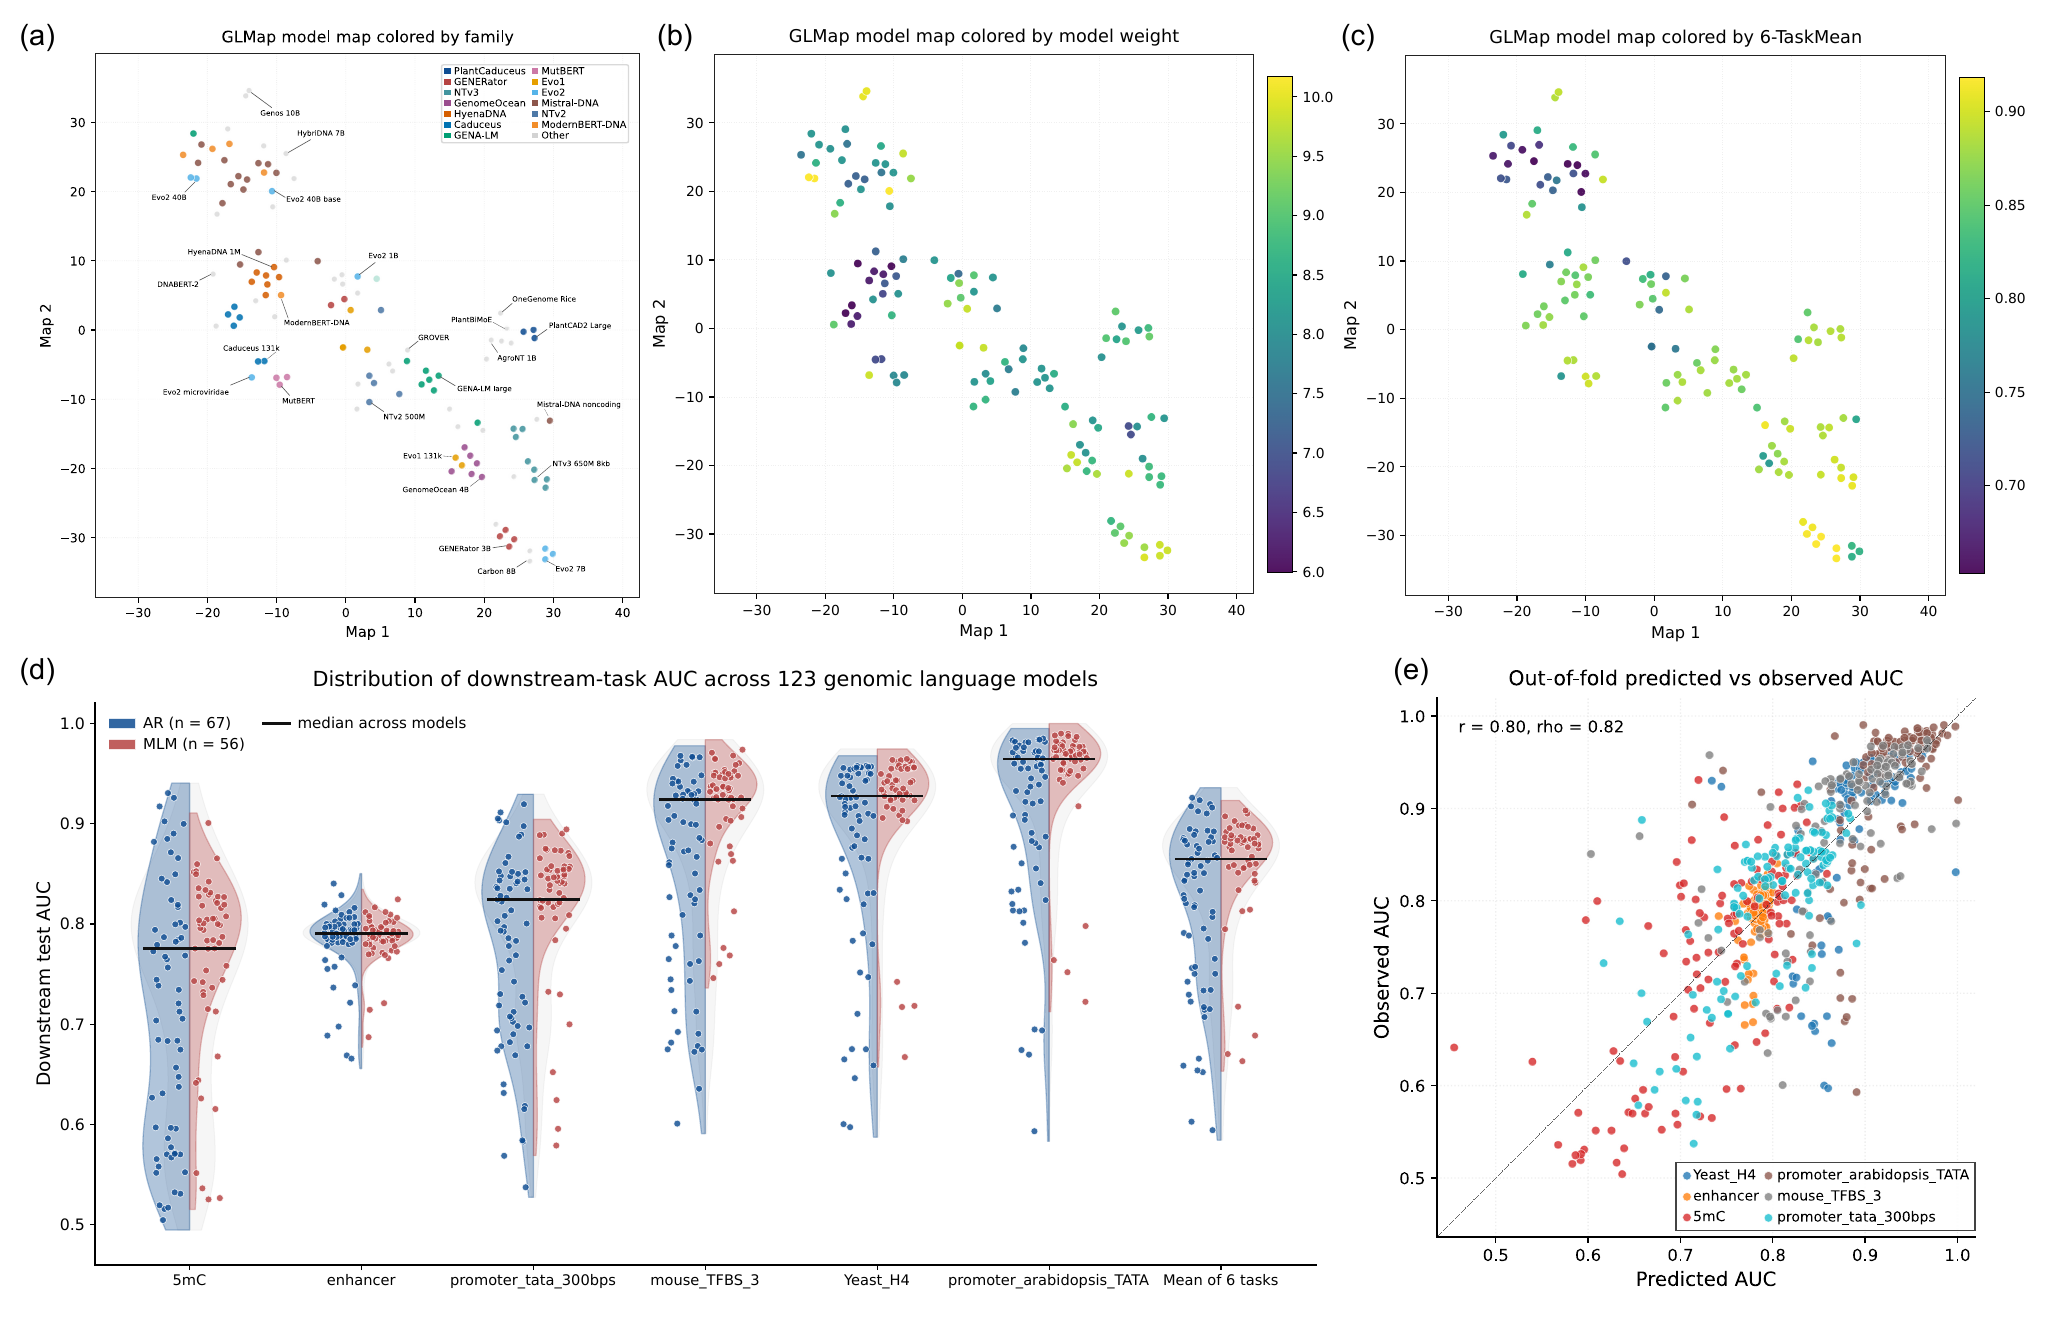
picking the right one. Yet today this relies on downstream benchmarks, which are phenotype-like: they record how a model behaves on a task, not how models relate to one another.

The same gap appears in population genetics (Fig. 1a, b): benchmark scores act as a phenotype matrix, but the genotype-derived marker matrix that reveals population structure has no counterpart for GLMs. A model's internal constitution (architecture, weights, tokenizer, objective, data) is non-aligned across models and cannot be compared directly. 
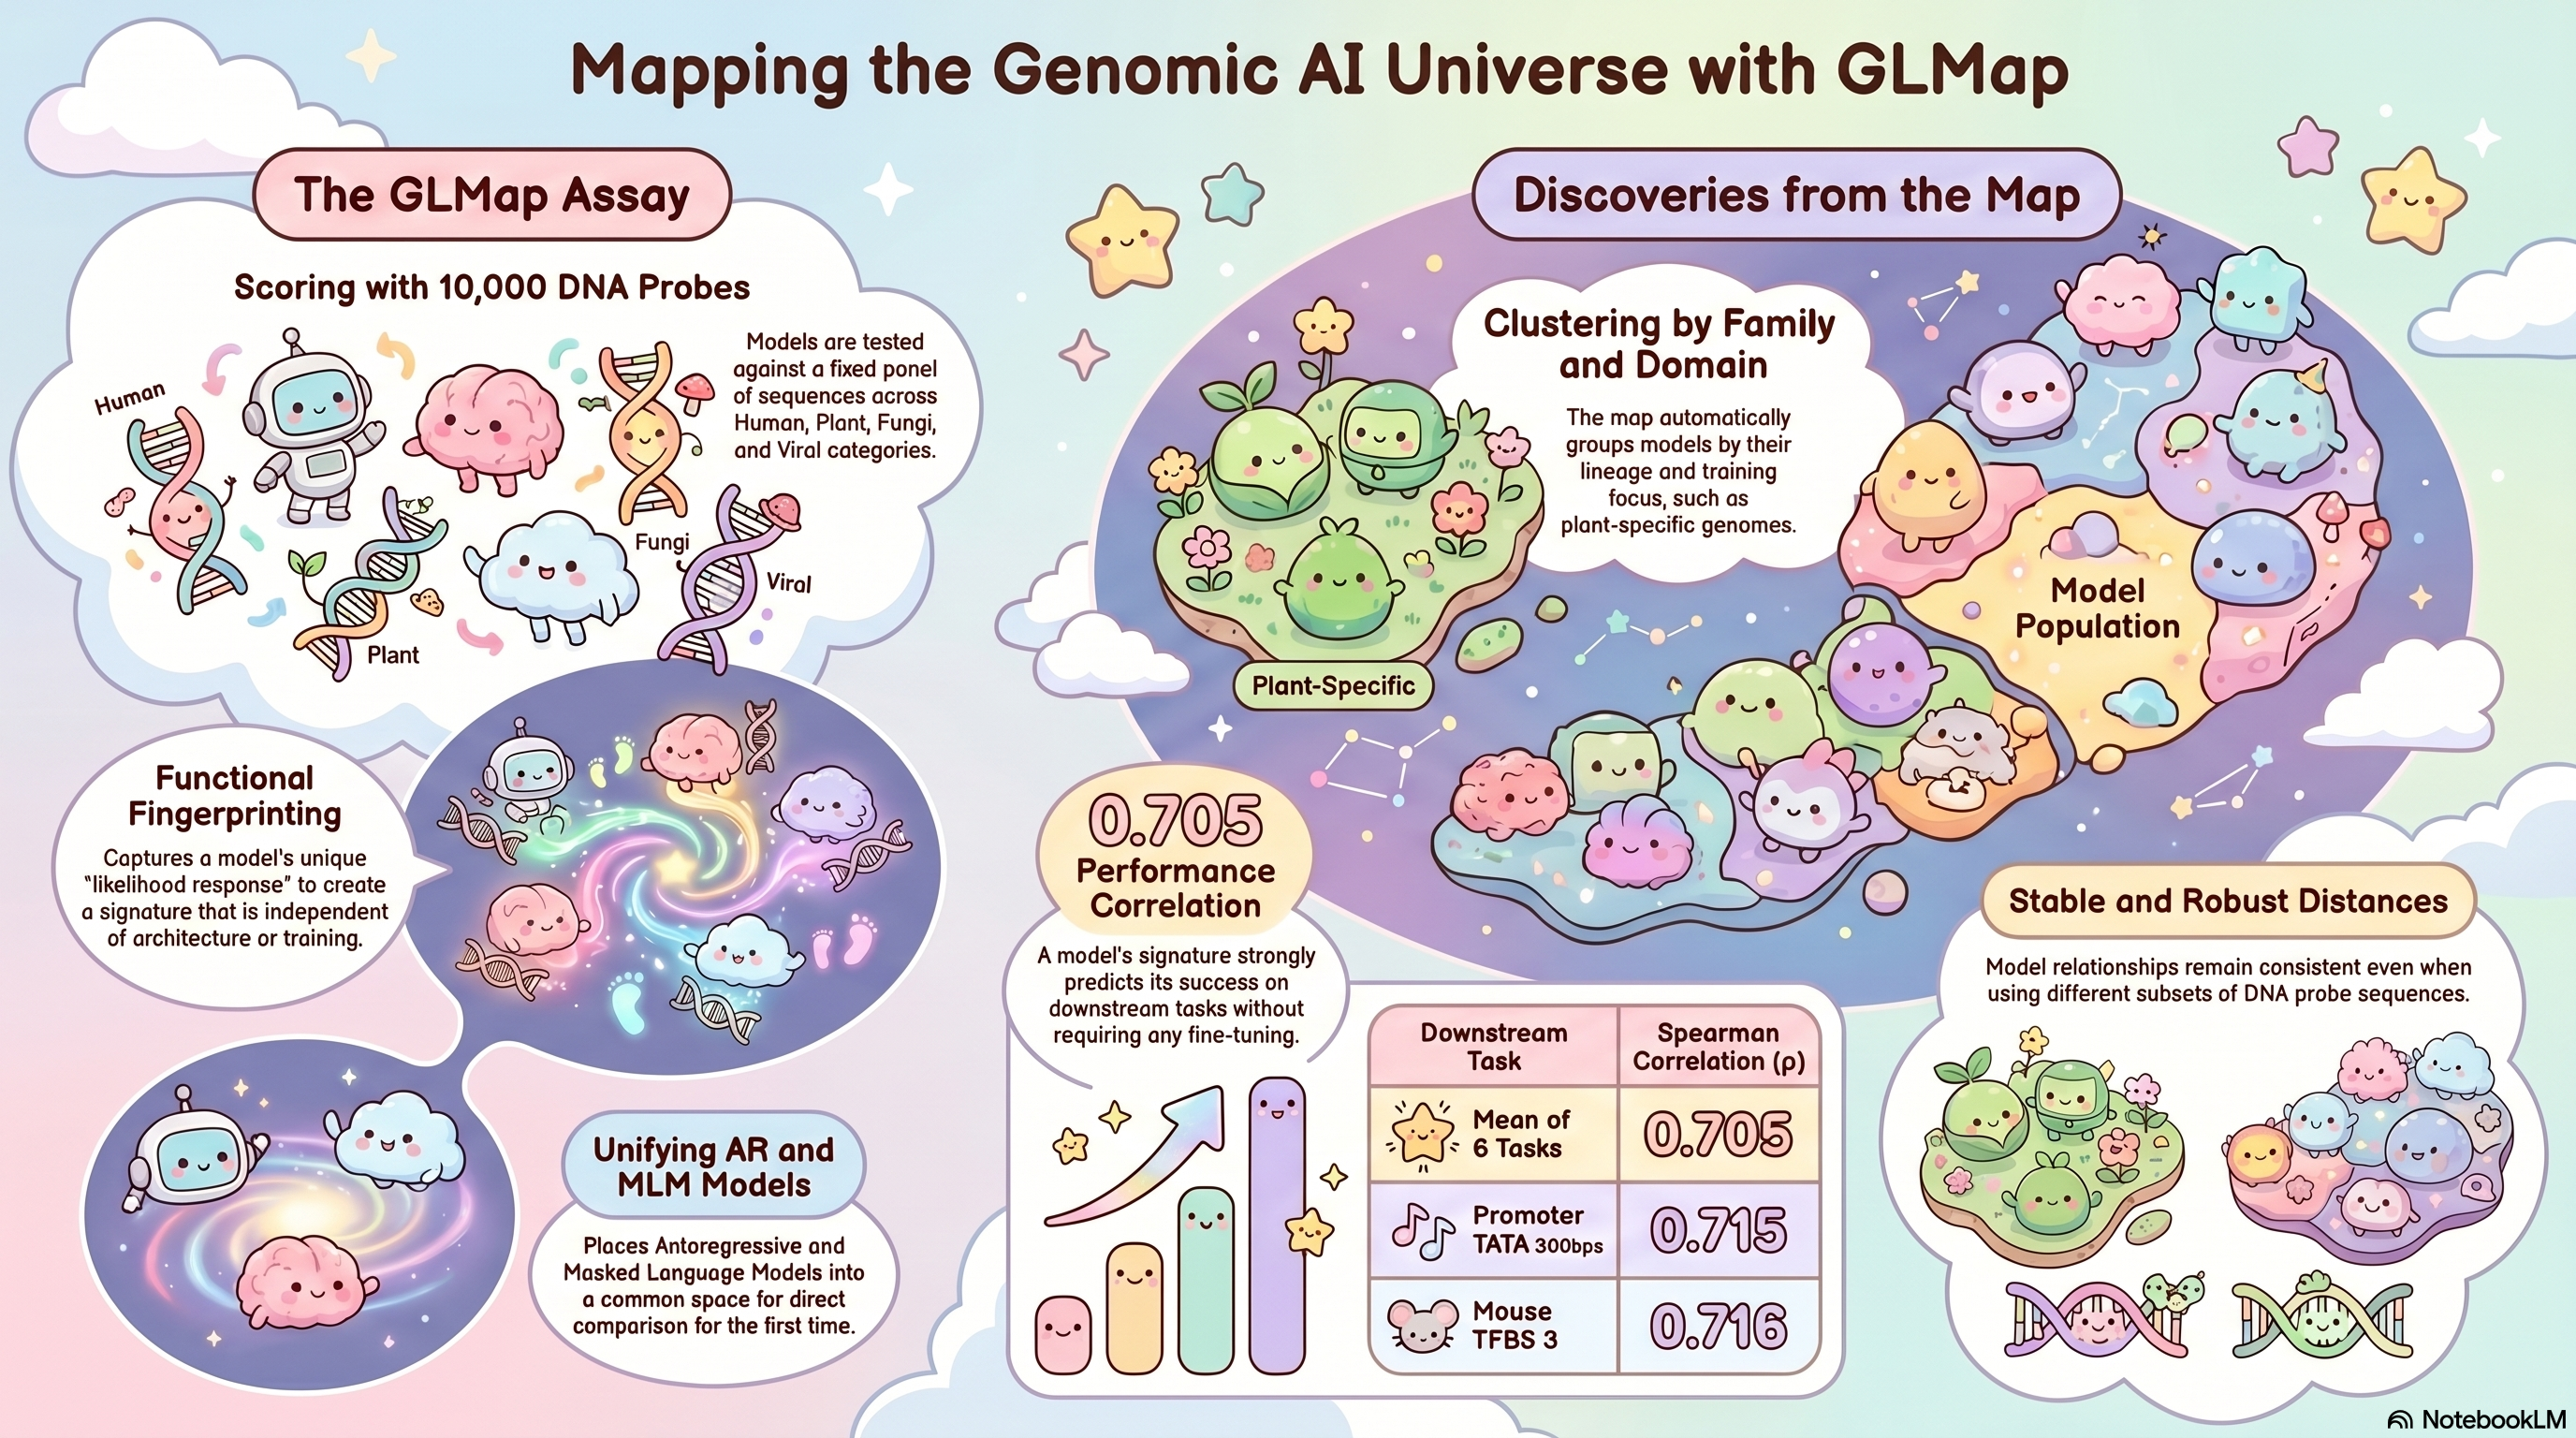
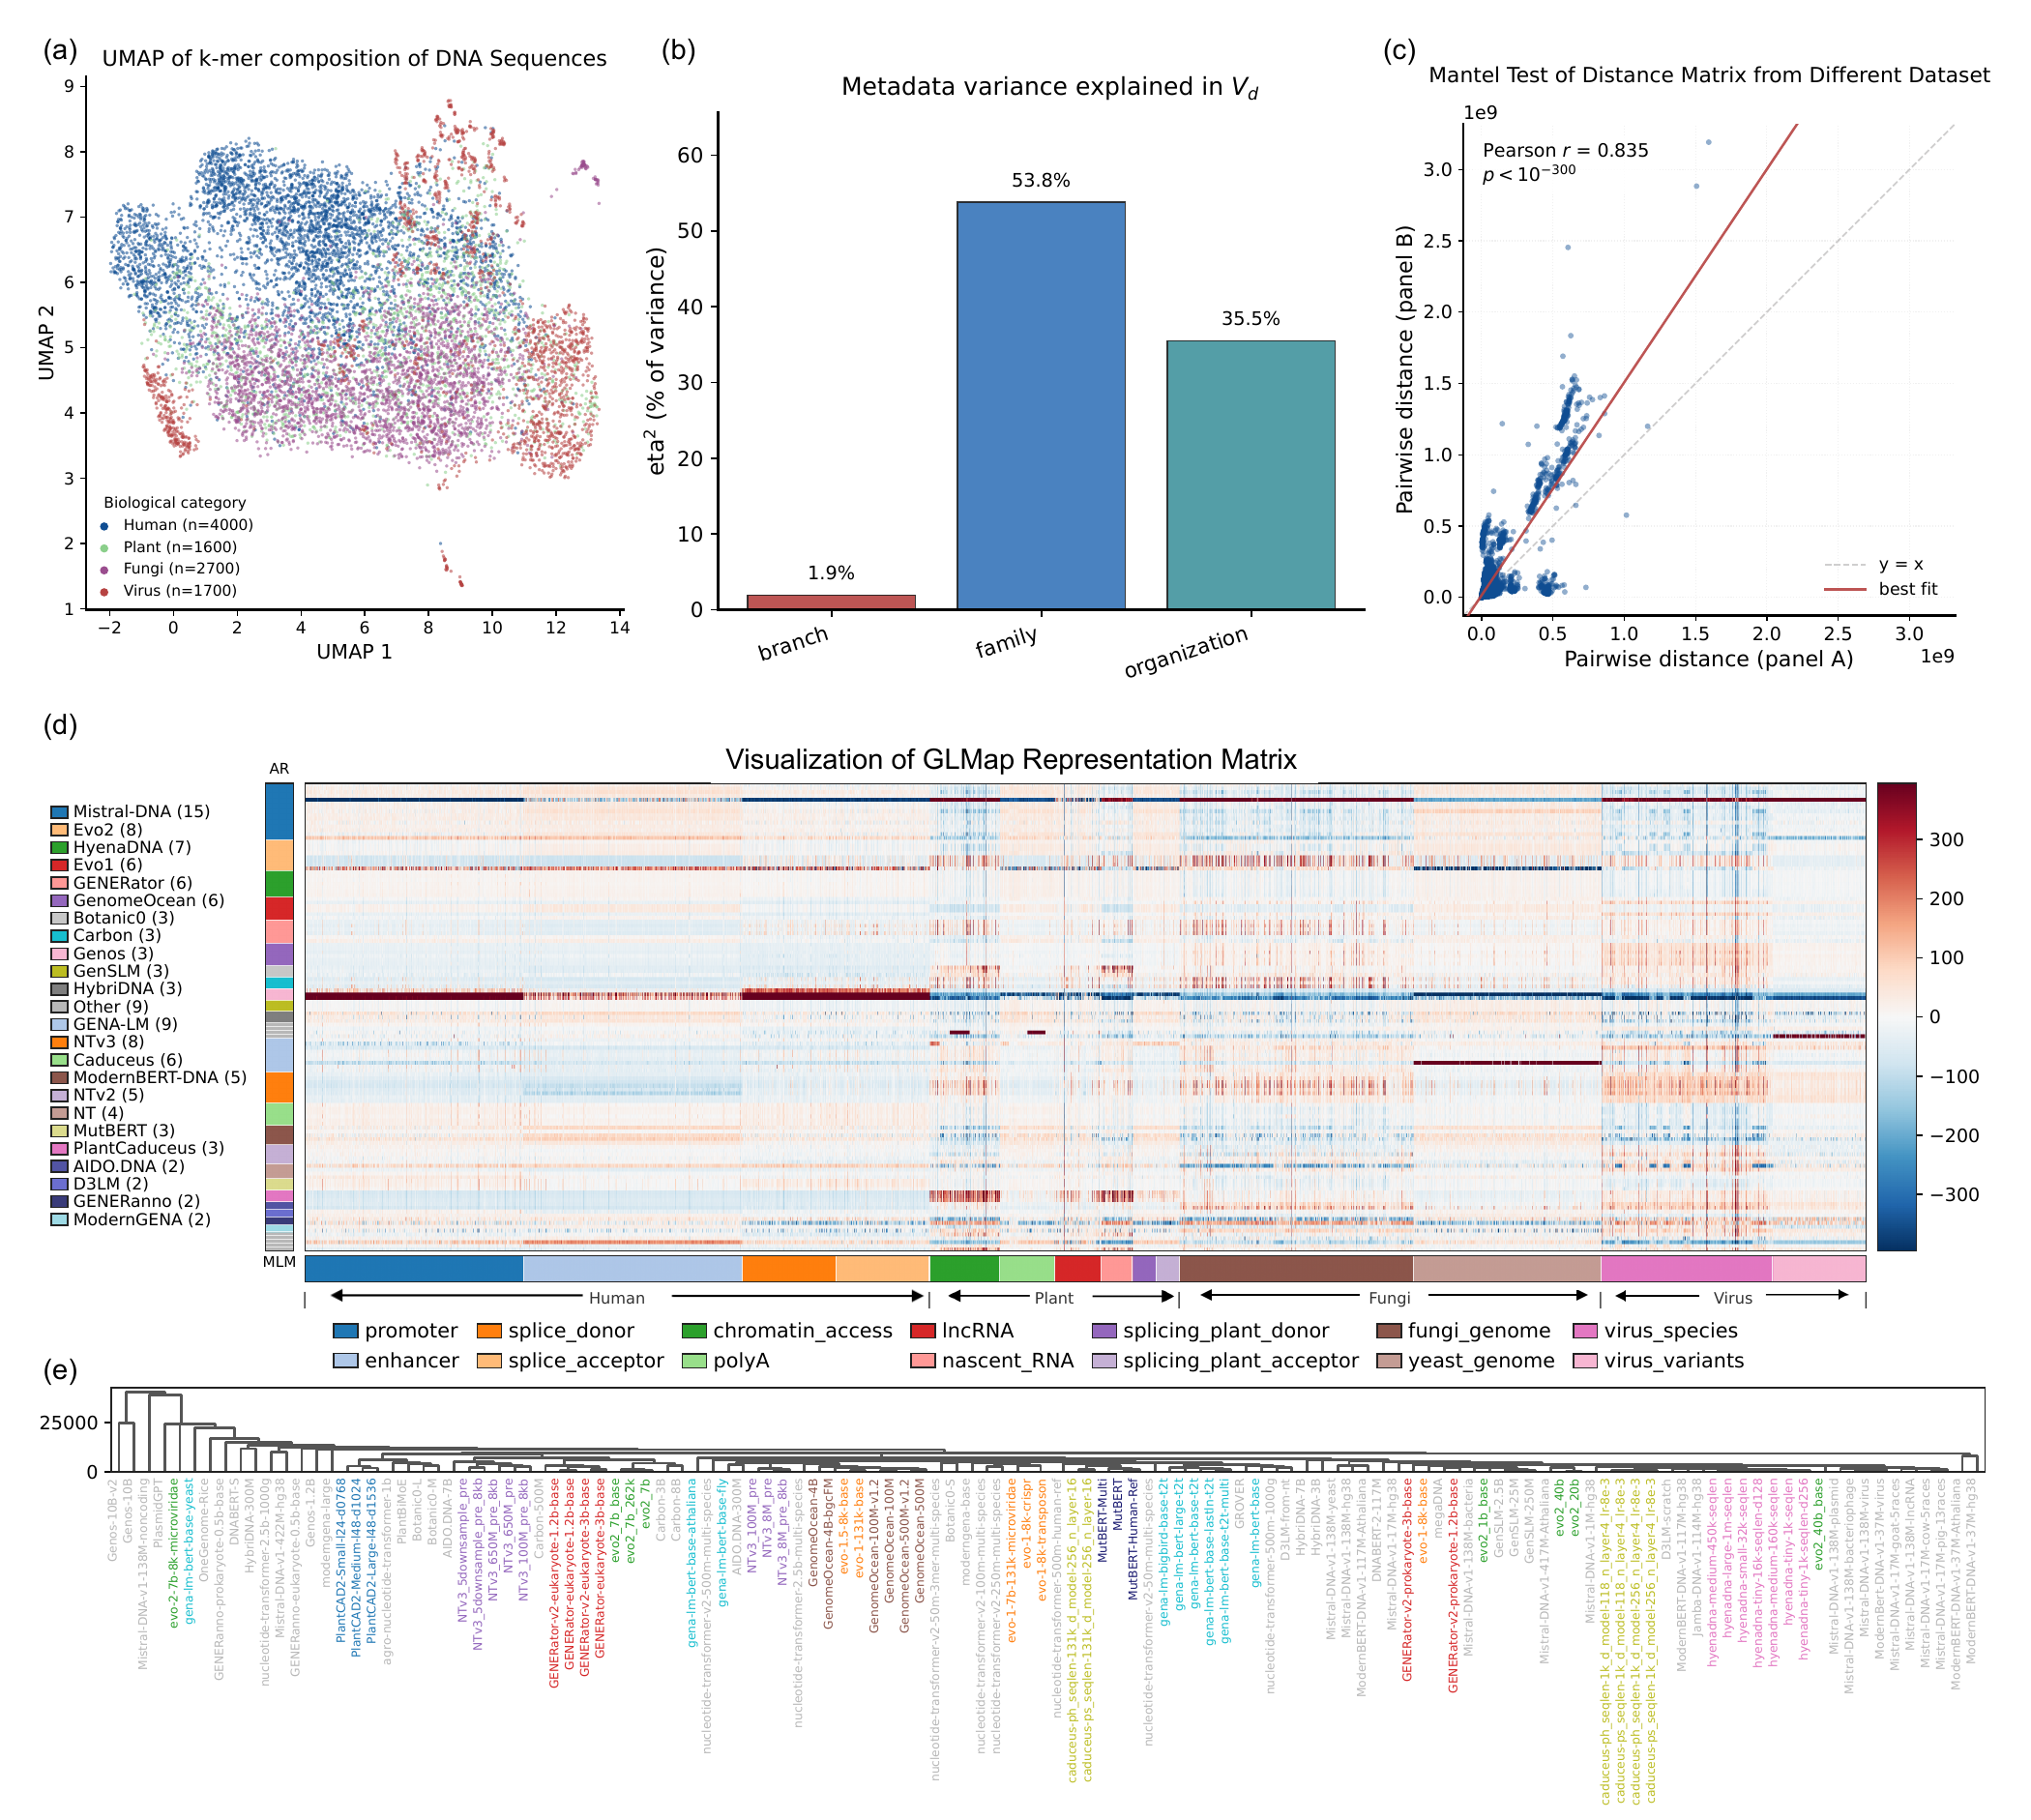
We propose GLMap, a standardized, model-agnostic framework (Fig. 1c): we score a fixed panel of DNA probes with every frozen model and record its (pseudo-)log-likelihood responses, assembling a functional marker matrix over models and probes.
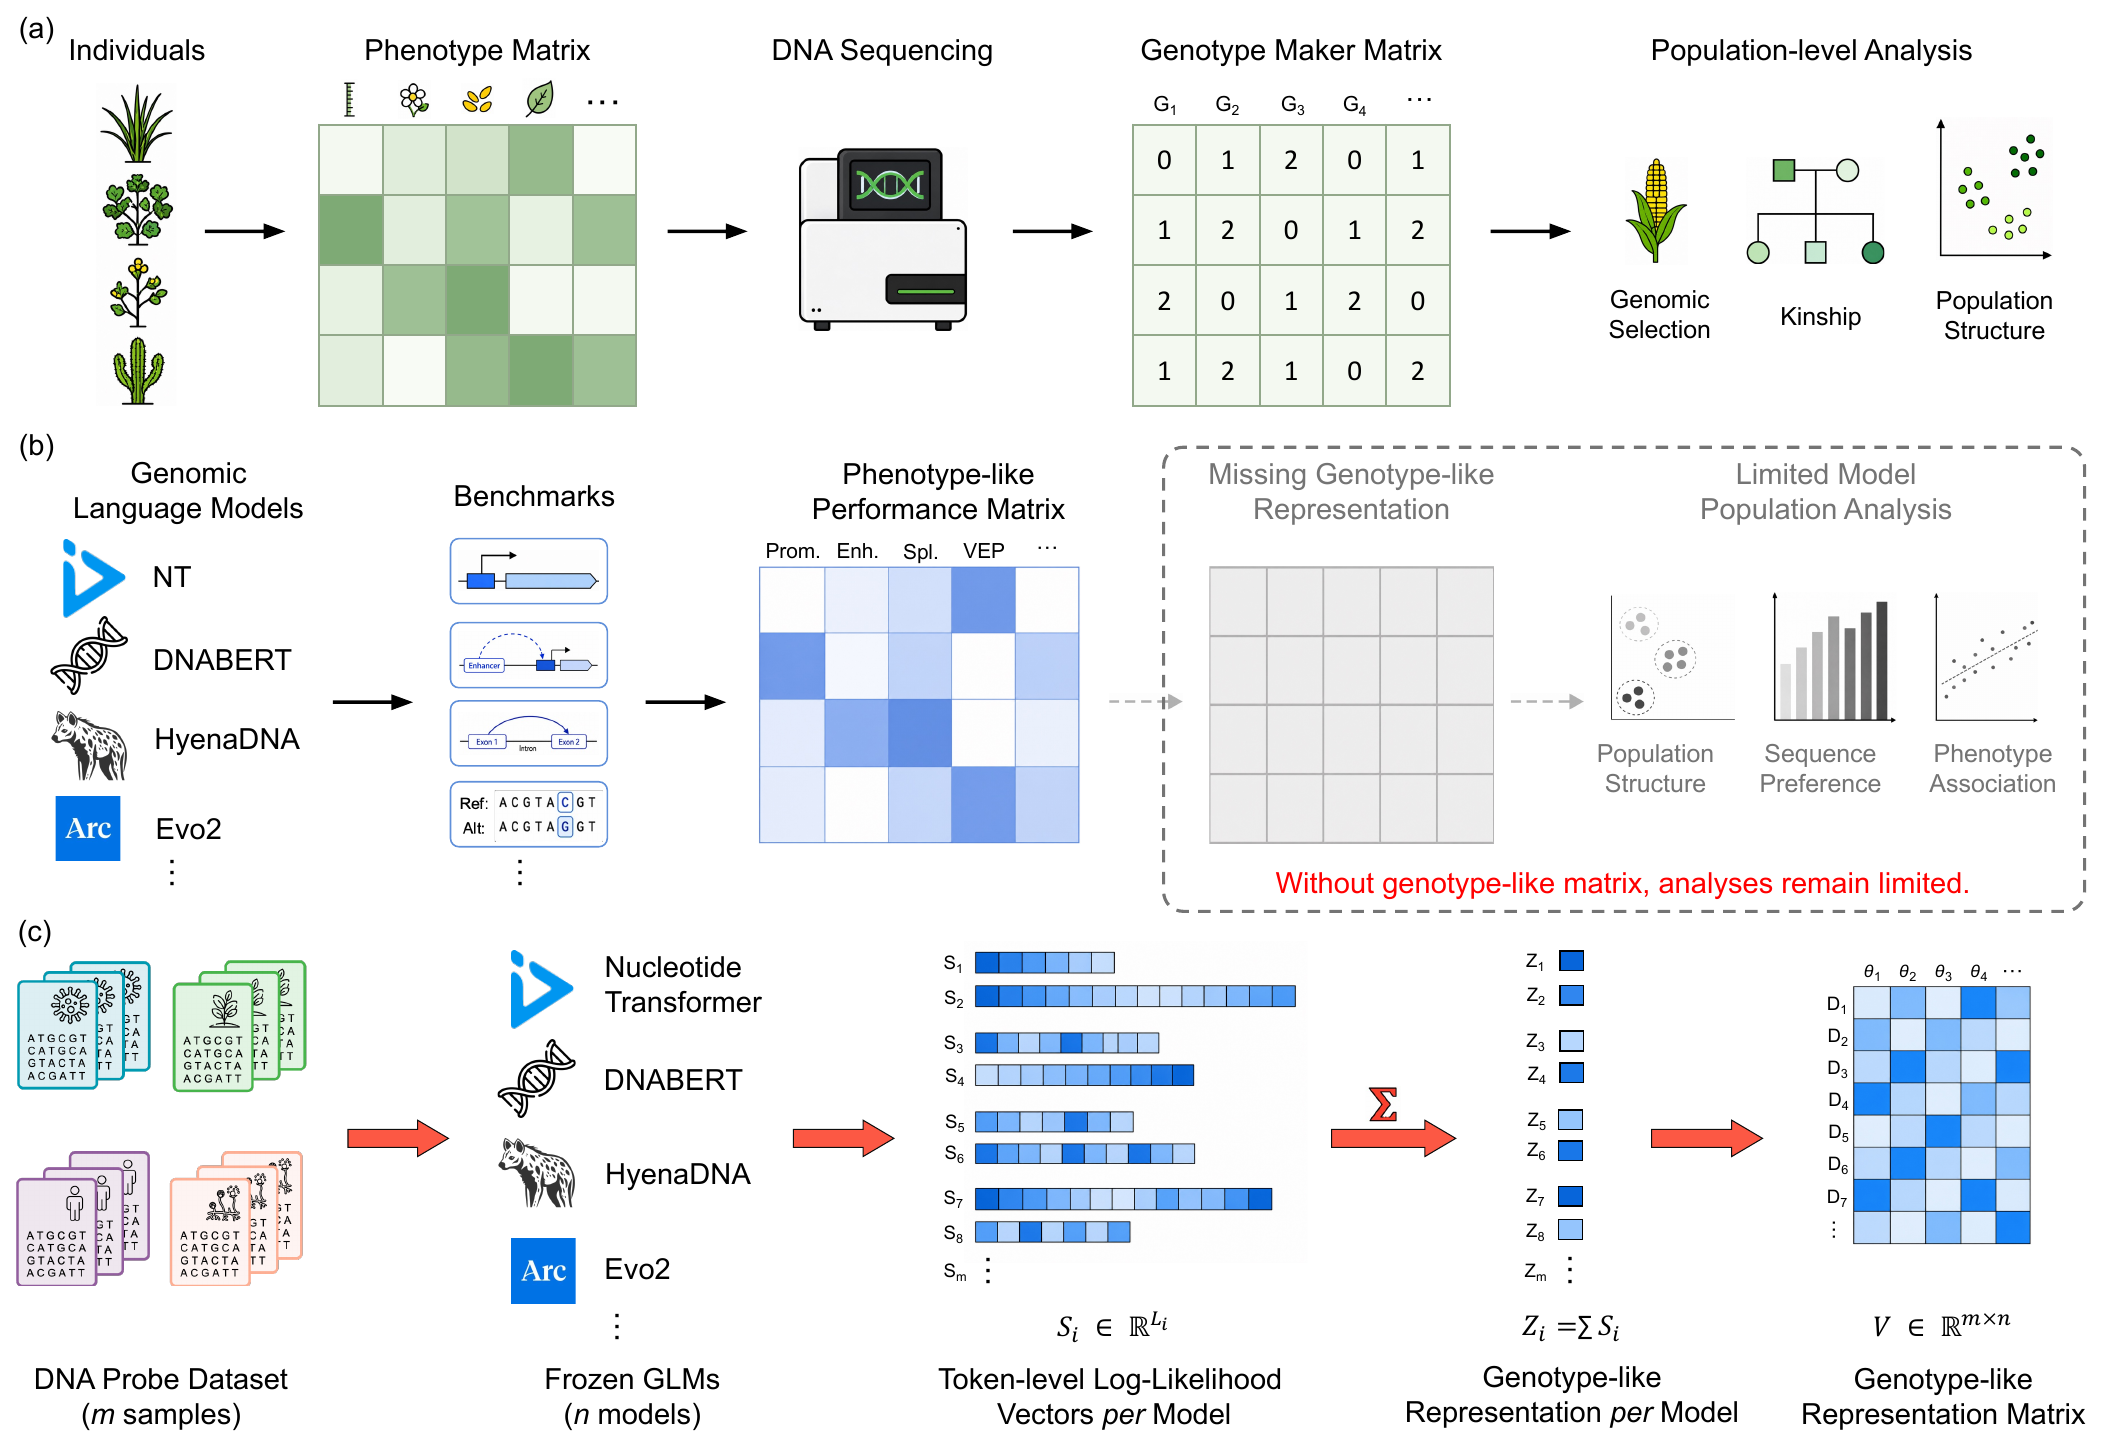
GLMap overview

Fig. 1. GLMap probes every genomic language model with the same fixed panel of DNA sequences and records its likelihood responses, producing a functional marker matrix over models and probes, a task-independent way to place heterogeneous models in a common space.

The GLMap representation

Every model scores the same 10,000-probe DNA panel, yielding a raw response matrix V. A ModelMap-style pipeline (lower-tail clipping of outliers, row-then-column double-centering, and pairwise squared-Euclidean distances) turns it into the centered signature matrix Vd and a model×model distance matrix D. Double-centering removes each model's overall score level and each probe's intrinsic difficulty, leaving only functional differences between models. The AR-vs-MLM scoring difference turns out to be minor: it is comparable in scale even in the raw scores and explains just 1.9% of the variance in Vd, so both paradigms can be analyzed in one common space.

GLMap representation matrix

Fig. 2. The GLMap probe panel and the resulting model representation. (a) UMAP of the k-mer composition of all 10,000 probes, colored by biological category. (b) Variance in Vd explained by three model metadata labels (η2); the AR/MLM branch explains only 1.9%, far less than model family (53.8%). (c) Mantel test comparing model-to-model distances computed independently on two element-disjoint halves of the panel (r = 0.835). (d) The GLMap representation matrix Vd across all 123 models: rows are models, grouped by family and labeled AR or MLM; columns are probes, grouped by functional element and biological category. (e) Hierarchical clustering of models by GLMap distance, with leaves colored by family.

Model map & downstream prediction

GLMap distances recover documented relationships among models and organize the 123-model population by family, training domain, and scale. The same signatures predict how well a model will perform on held-out downstream classification tasks, without ever fine-tuning it.

GLMap model map and downstream prediction

Fig. 3. Model map of the 123-model population and prediction of downstream task performance. Predicted vs. observed mean AUC across six tasks correlates at Spearman ρ = 0.705 under random K-fold cross-validation.

Future directions

  • Broader, multi-species panels. Extending the probe panel to additional species and element classes would test whether the model geometry is stable out of sample and reveal domain-specific structure beyond the current coverage.
  • A living atlas of models. Because new models can be projected into an existing Vd space without recomputing prior signatures, GLMap can grow into a continuously updated map that tracks the GLM population as it evolves.
  • From description to selection. Explore whether GLMap signatures can guide practical model selection and ensembling, choosing or combining models for a new task without exhaustive fine-tuning.

Citation

@article{hou2026glmap,
  title   = {Profiling genomic language models as individuals in a population},
  author  = {Hou, Yusen and Long, Weicai and Su, Houcheng and Feng, Junning and Zhang, Yanlin},
  journal = {In submission},
  year    = {2026}
}

Acknowledgements

GLMap builds on the ideas of several outstanding open-source projects.

The clip + double-center pipeline applied to log-likelihood vectors originates from ModelMap (Oyama et al., ACL 2025), which is a really solid and nice work!
The suite of binary classification tasks used in our downstream evaluation comes from the DNA Foundation Benchmark (Feng et al., Nat. Commun. 2025).
We also thank the authors and maintainers of the 123 genomic language models audited in this work for releasing their weights and code publicly, which made this study possible.